How the Best
Get Better
Professional-grade compression recovery
systems engineered for elite athletes
who refuse to settle.
Hyperice went mass-market.
They left the top to us.
- Premium product
- Pro athletes and the people who train like them
- The brand trickled down — triathletes, serious amateurs, anyone chasing pro-level recovery
- ~$148M raised to win shelf space
- Lower prices, lower quality
- Big-box retail — built for the average consumer
- Pros, universities, athletes who refuse to compromise
- The people who built recovery culture — and the consumers who follow them
- No premium option exists
"Traveled with a ShopVac for years to deflate his Normatecs. One demo of Rapid Reboot Regen, and Ohio State switched."
We're built for the top — and the top is where the consumer market follows.
Meet the
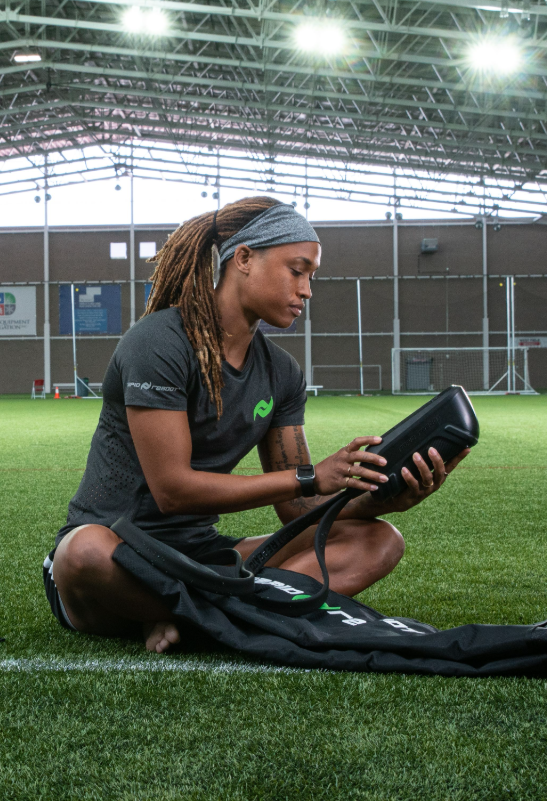
Rapid Reboot Regen.
FDA-cleared. Patent-protected. Built for the people who can't be wrong about recovery.
Rapid Deflate
Deflates the attachment in seconds after a session. For programs cycling 20+ athletes, it's a game-changer. For individual athletes, a convenience no other system offers.
Patent Protected
Chamber-by-Chamber Adjustability
The only system on the market that allows the user to control pressure zone by zone. Target specific areas, skip injured zones, tailor every session to the athlete, the load, and the day.
Patent ProtectedHigher Pressures
Twice the pressure and 7× faster than the Normatec Elite system. More blood flow means more nutrients delivered to cells and more metabolic waste removed. Better circulation equates to faster recovery.
Those in The Know.
4 out of the Last 5 NCAA Football National Championship Teams


From the Locker Room
to the Living Room.
The compression therapy market exceeds $4 billion globally. Our focus is university athletics: the smallest viable niche that unlocks every market we want to reach.
| Assumption | Value | Confidence | Source |
|---|---|---|---|
| D1 teams | 350 schools · 6,750 teams · ~19 sports/school | Official | NCAA 2024–25 [S1] |
| D2 teams | 310 schools · 5,021 teams | Official | NCAA 2024–25 [S1] |
| D3 teams | 460 schools · 8,157 teams | Official | NCAA 2024–25 [S1] |
| NAIA | 235 schools · 83,000+ athletes | Official | NAIA 2025–26 [S3] |
| Penetration | D1: 90%Upper D2: 50%D3/NAIA: 10% | Estimated | Management estimate |
| Units per team | 2 avg (football: 4–6 · small sports: 1) | Estimated | Industry assumption |
| Replacement cycle | 5 years | Estimated | Standard equipment lifecycle |
| Pricing | Premium only · Retail avg ~$1,160 · 20% bulk discount → $928/unit | Confirmed | Rapid Reboot / Hyperice [S5][S6] |
| Accessories | +30% on hardware | Estimated | Standard B2B equipment |
- S1
- S2
- S3
- S5
- S6
| Assumption | Value | Confidence | Source |
|---|---|---|---|
| D1 athletes | 202,353 (2024–25 record) | Official | NCAA [S1] |
| D2 athletes | 141,067 | Official | NCAA [S1] |
| D3 athletes | 210,878 | Official | NCAA [S1] |
| NAIA athletes | 83,000+ | Official | NAIA [S3] |
| Adoption rate | D1: 100%D2: 70%D3: 35%NAIA: 20% ⚠ Most sensitive variable — every 10% shift in D2 = ±$13M/yr | Estimated — weakest | Management estimate |
| Athletes addressed | ~391,500 athletes | Derived | NCAA + NAIA [S1][S3] |
| Annual replacement | 33% / yr = 25% athlete turnover + 8% equipment wear | NCAA-derived | NCAA turnover [S2] |
| Pricing | Retail avg ~$1,160 · 35% fleet discount → $754/unit | Confirmed | Rapid Reboot [S6] |
- S1
- S2
- S3
| Assumption | Value | Confidence | Source |
|---|---|---|---|
| Methodology | Top-down: NA share of global air compression recovery boots market | Established | [S7–S10] |
| Global market 2024 | $150M narrow [S7]$258–285M mid [S9]$1.35B broad [S8][S10] Discrepancy reflects scope: sports-only vs. sports + medical | Variable by definition | [S7–S10] |
| Working estimate | ~$1.0–1.35B global (broad sports + medical) | Moderate | Metatech [S8]; ShelfTrend [S10] |
| NA market share | 40–50% of global | High — multiple | DataHorizzon [S9]; Metatech [S8] |
| Market CAGR | 7.2–8.5% through 2033–2035 | High — multiple | Metatech 7.2% [S8]; VMR 8.5% [S7] |
| Pro teams (bottom-up) | 154 major US teams × 17 units ÷ 4yr × $928 = ~$1–2M/yr | High — calculated | League rosters; [S6] |
- S7Air Compression Recovery Boots Market — Verified Market Reportsverifiedmarketreports.com ↗Market research
- S8
- S9Global Air Compression Recovery Boots — DataHorizzon Researchdatahorizzonresearch.com ↗Market research
- S10
| Assumption | Value | Confidence | Source |
|---|---|---|---|
| Market definition | Full global PCT — medical-grade DVT prevention, lymphedema, post-surgical, sports recovery, consumer wellness | Well-defined | [S11–S14] |
| PCT market 2024 | $3.18B [S11]$4.25B [S12]$4.59B [S14] | High — multiple | [S11][S12][S14] |
| CAGR | 5.5–7.3% through 2030–2033 | High — multiple | [S12][S13][S15] |
| Current RR access | US only — FDA Class II clearance; international requires country-specific approval | Confirmed | Management [internal] |
| What unlocks it | International expansion + medical channel + elder care / corporate wellness | Strategic | Management strategy |
- S11Pneumatic Compression Therapy Market — Verified Market Researchverifiedmarketresearch.com ↗Market research
- S12
- S13
- S14
- S15
Two channels.
One compounding engine.
How one sale turns into a campus, a region, and a consumer market.
The Campus Flywheel
Equip one sport. Athletes recover faster. Coaches request systems. Boosters fund NIL expansion. Every sport becomes a sales rep for every other sport on campus.
The Regional Flywheel
When a school equips its athletes, rival schools feel the pressure. Coaches talk. Trainers compare notes. Recruits notice. Athletic directors respond.
The Channel Flywheel
Universities expose celebrity athletes to Rapid Reboot through trusted coaches and trainers, turning them into future customers and advocates. Consumers follow their lead — every campus win drives downstream demand.
Unit Economics
A Massive Market
Moving in Our Direction.
Grand View Research — Compression Therapy Market Size, Industry Report (2030)
Global compression therapy market estimated at USD 4,248.6M (~$4.25B) in 2024, projected to reach USD 5,339.7M by 2030 at 3.8% CAGR.
View Source →Future Market Insights — Fitness Recovery Services Market (2025–2035)
Global fitness recovery services market valued at USD 8.3B in 2025, projected to reach USD 26.8B by 2035 at 12.4% CAGR.
View Source →Metatech Insights — Air Compression Recovery Boots Market (2025–2035)
Air compression recovery boots market valued at USD 1.35B in 2024, projected to reach USD 2.9B by 2035 at 7.2% CAGR.
View Source →NFHS — High School Athletics Participation Surges in 2024–25 (All-Time Record)
8,266,244 total high school sports participants in 2024–25 — a record high.
View Source →NCAA.org — 2024–25 NCAA Membership Breakdown (August 8, 2024)
Official NCAA membership data: 355 D-I, 293 D-II, 425 D-III = 1,073 active institutions.
View Source →Their strengths are
also their weaknesses.
Hyperice and Therabody products are designed for the consumer market, which makes them less appealing to professionals.
.SVG)
Rapid Reboot Regen
Our product is fundamentally different: double the pressure, 7× faster cycle time, per-zone adjustability, rapid deflate, and a full smartphone display built into the pump. Every other system is a flip phone by comparison — which is why we have a very high rate of flipping universities from Hyperice to Rapid Reboot.
- ✓Rapid Deflate — Protected by Patent
- ✓Twice the pressure of our main competitors — 200 mmHg vs. 100 mmHg
- ✓7 cycles per 10-min session vs. 2 → more blood flow
- ✓Chamber-by-chamber pressure adjustability (Protected by Patent)
- ✓Smartphone display built into the pump
- ✓Every recovery protocol fully customizable
- ✓Class II medical device — FDA-cleared for prescription & OTC sales
- ✓Patent-protected moat
Normatec / Hyperice · Therabody
- Hyperice: ~$150M–$200M est. annual revenue
- Therabody: ~$250M–$400M est. annual revenue
Hyperice is in nearly every athletic department in the country — but trainers and ADs are frequently frustrated with poor performance, build quality, and support. That makes them an easy switch once we're in the room. The bottleneck isn't the pitch — it's the cost of getting face-to-face.
- ✓Strong D2C brand & retail distribution
- ✓Ubiquitous in athletic departments — but ripe to switch
- ✗Frustrations: performance, quality, support
- ✗No rapid-deflate
- ✗No chamber-by-chamber pressure control
- ✗100 mmHg max vs. 200 mmHg on Rapid Reboot
- ✗2 cycles per 10-min session vs. 7 on Rapid Reboot
Budget Brands · Amazon
Commodity imports. A race to the bottom Rapid Reboot doesn't participate in — and these systems can't touch professional teams, universities, or the elite training facilities their athletes rely on.
The best want the best equipment. They don't want this.
- ✗Typically no FDA clearance
- ✗No institutional credibility
- ✗No precision controls
- ✗Disposable build quality
- ✗No warranty worth having
Who We Are.
Own the Top.
The Market Follows.
Proven Business
- ✓60+ college athletic departments
- ✓90% in-person close rate
- ✓~70% gross margin
Massive Market
- ✓$4B+ global compression therapy market
- ✓$1B+ consumer recovery market — the destination
- ✓1,073 NCAA schools, ~5% penetrated
Unrivaled Product
- ✓FDA-cleared
- ✓Patent-protected valve & adjustability
- ✓2× the pressure, 7× the cycles vs. Hyperice
Use of Funds
Inventory & Working Capital
Systems ready for both consumer orders and large program orders without delays.
B2B Growth
Athlete partnerships and more demos at universities that seed campus visibility and drive consumer awareness simultaneously.
D2C Growth
Digital marketing, paid acquisition, content production, and e-commerce optimization.
Technology and Ops
AI-powered sales tools, e-commerce infrastructure, production scaling, and logistics.
Ready to Talk?
Capital deployed across both channels — D2C for near-term revenue, B2B for long-term dominance.